
Bitcoin cycle analysis
Bitcoin's supply schedule changes every four years, at the halving, and its past cycles are often described against that rhythm. CycleLens shows where today falls on that calendar and where price sits against its own long history — as separate readings, each with its method, so a date is never mistaken for a forecast.
In short
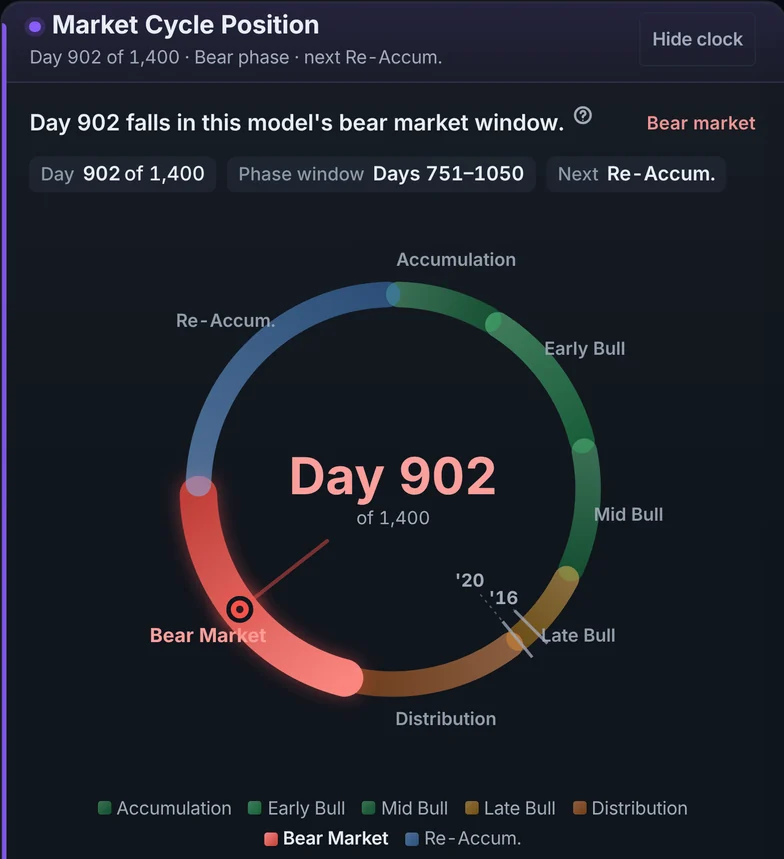
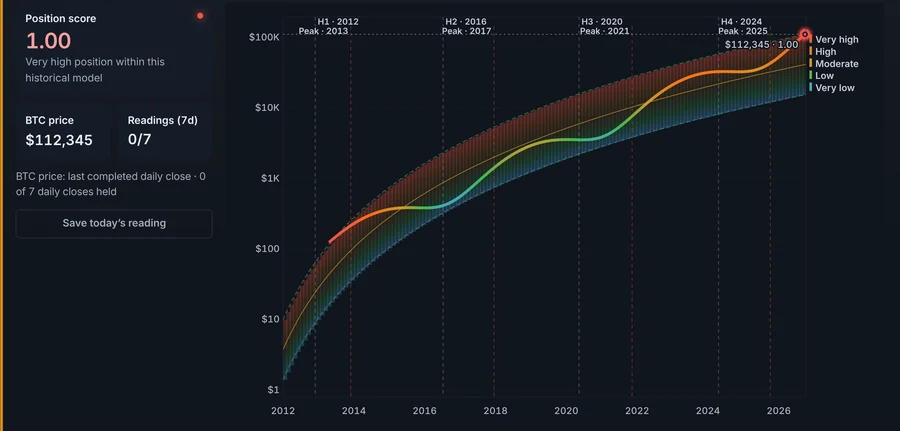
Cycle Analysis counts the days since the last halving and names the phase a calendar model assigns to that day; separately, it measures where Bitcoin's price sits inside a channel fitted to every daily close since 2013. The two answer different questions — one is about the date, the other about the price — and they are shown side by side, never blended into one verdict.
Three readings, three questions
- The calendar model. How many days have passed since the last halving, and which of seven phases that day falls in. It is a description of the calendar, not of price.
- Position in the long-run channel. Where today's price sits between the lower and upper edges of a channel fitted to Bitcoin's daily closes, scored from 0 to 1. It says how stretched price is against its own history, not what happens next.
- The market-cap regression and the weekly macro channel (BTC Macro). Longer-horizon fits on the whole market's value and on Bitcoin's weekly closes, with the fitted window printed beside each.
What it will not tell you
Four halvings is a small sample. None of these models has been validated as a way to time a top or a bottom, and the product says so where each reading is shown. They are useful for context — how unusual today is against the past — and for asking better questions, not for deciding what to do.
See the cycle charts
The charts page shows the position chart and the regression.
Try CycleLens
The dashboard needs no account. Pro can be tried free for 7 days, with no card.