
Crypto market analysis that shows its working
CycleLens is for people who already invest and want to understand what crypto markets are doing — without spending hours reading charts, order books and research notes. It gathers the figures that matter, explains them in plain words, and shows where its numbers came from and when they were taken.
In short
CycleLens is a crypto market dashboard with explanations built in. It covers the whole market, individual coins, Bitcoin's halving cycle and your own portfolio, and its Forensics reports explain why a price moved, step by step.
What you can do with it
Find out why a price moved
A Forensics report reads the last 24 hours of a coin, finds the move that matters, and works out where it started, what came next and what the evidence cannot show.
Read Bitcoin's cycle
Where Bitcoin sits in its four-year halving rhythm on a calendar model, and where its price sits against its long history, each reading named with what it measures and what it cannot.
See your portfolio clearly
Record what you hold and see its value, its concentration and how your day compares with the whole market — without connecting an exchange.
The dashboard
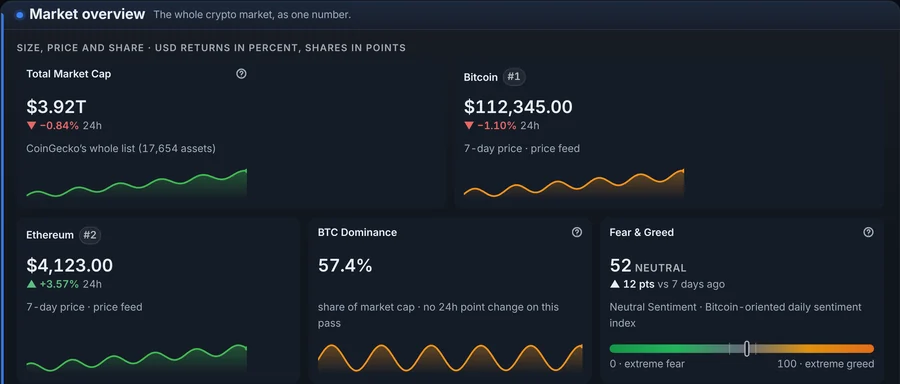
The dashboard opens on the whole market: its total value, Bitcoin's and Ether's prices, Bitcoin's share of the total, and the Fear & Greed index, each with its 24-hour change and a week of shape. Below it are the movers, the trending coins and a table of 750 coins ordered by market value, each with its own page of charts, market data and fundamentals.
How it explains itself
- Figures are dated. A reading carries the time it was taken and the source it came from; a figure from a slow source is shown with its age rather than passed off as current.
- Every model is named. A reading says which model produced it and over what horizon — a calendar model counting days since the halving is never presented as a price forecast.
- Plain words first, method on request. Each section opens with what it shows in a sentence or two; the method, the definitions and the limitations sit one step below.
- The limits are stated. Where something was not measured, the page says so instead of filling the gap. See the methodology for how this works.
What is free
The dashboard, the market table, coin pages with their charts and market data, the Bitcoin and Ether Forensics reports, and a portfolio of up to 5 holdings are free, with no card. Pro adds the model readings, Cycle Analysis, BTC Macro, Alt Radar scans, the daily briefing, unlimited tracking and 100 assistant questions a month. The pricing page has the full comparison.
See the market now
The dashboard needs no account.
Try CycleLens
The dashboard needs no account. Pro can be tried free for 7 days, with no card.