
Bitcoin dominance and market breadth: why they can tell different stories
"Bitcoin dominance is falling, so altcoins are rallying" is one of the most repeated lines in crypto commentary. Sometimes it is true. This guide shows why dominance can fall while most coins fall too, and what to read alongside it.
The short answer
Bitcoin dominance is Bitcoin's share of the total crypto market value, so it moves with the relative size of the largest coins and with whatever is counted in the total — stablecoins included. Market breadth counts how many coins are rising, or are above a moving average, giving every coin one vote. Because one is weighted by size and the other is not, they can point in opposite directions.
Two different questions
- Dominance asks: how big is Bitcoin compared with everything? It is Bitcoin's market value divided by the total market value. A few large coins carry most of the total, so a move in Ether alone can shift it.
- Breadth asks: how many coins are going up? It is a count — the share of coins with a positive change, or the share above their 50-day average — so the 300th-largest coin counts as much as the second.
A worked example
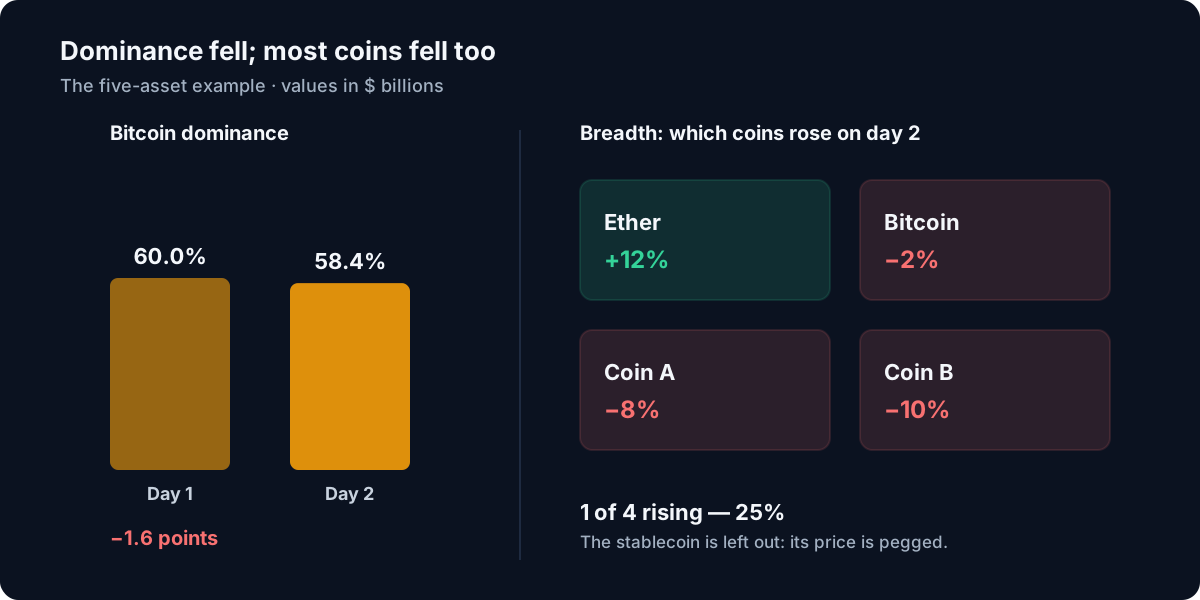
Take a small market of five assets, with values in billions of dollars. On day 2, Bitcoin falls 2%, Ether rises 12%, two smaller coins fall 8% and 10%, and the stablecoin stays at its peg.
| Asset | Day 1 | Change | Day 2 |
|---|---|---|---|
| BTC | 600 | −2% | 588.0 |
| ETH | 200 | +12% | 224.0 |
| Stablecoin | 150 | 0% | 150.0 |
| Coin A | 30 | −8% | 27.6 |
| Coin B | 20 | −10% | 18.0 |
| Total | 1,000 | 1,007.6 |
- Bitcoin dominance falls from 60.0% to 58.4% — down 1.6 points.
- Breadth — the share of the 4 non-stablecoin assets that rose — is 1 of 4, or 25%.
The stablecoin effect
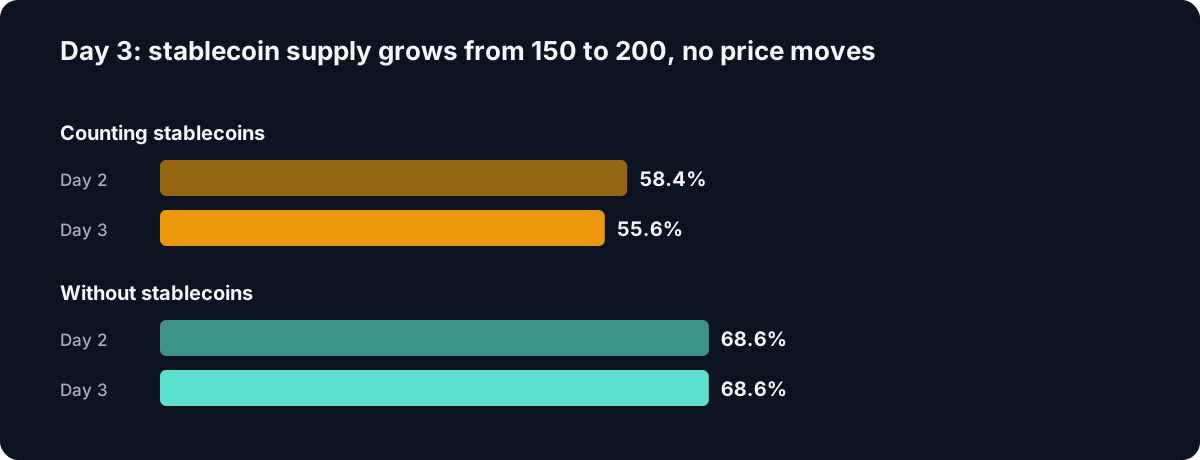
The widely quoted dominance figures — CoinMarketCap's and CoinGecko's — count stablecoins in the total. When new stablecoins are issued, the total grows and Bitcoin's share shrinks even if no price moves. In the example, if the stablecoin's supply grows from 150 to 200 billion on day 3 with every price unchanged, dominance falls again, from 58.4% to 55.6%.
This is also why sites disagree on dominance on the same day: they divide by different totals — every coin a site lists, or a fixed number of the largest — so check what a figure includes before comparing two of them.
Reading them together
| Dominance | Breadth | Consistent with |
|---|---|---|
| Falling | Broad (most coins rising) | A wide move into smaller coins. |
| Falling | Narrow (most coins falling) | One or two large coins rising, or stablecoin supply growing. |
| Rising | Narrow | Bitcoin holding up better than a falling market. |
| Rising | Broad | A broad rise led by Bitcoin. |
Common misunderstandings
- "Falling dominance means altcoin season." Only if breadth agrees. Check how many coins are actually rising.
- "Dominance is a price." It is a ratio. It can fall while Bitcoin rises, if the rest of the market rises faster.
- "Breadth tells you the market is healthy." It counts coins equally, so a rally in thousands of tiny coins can look broad while most of the market value is flat.
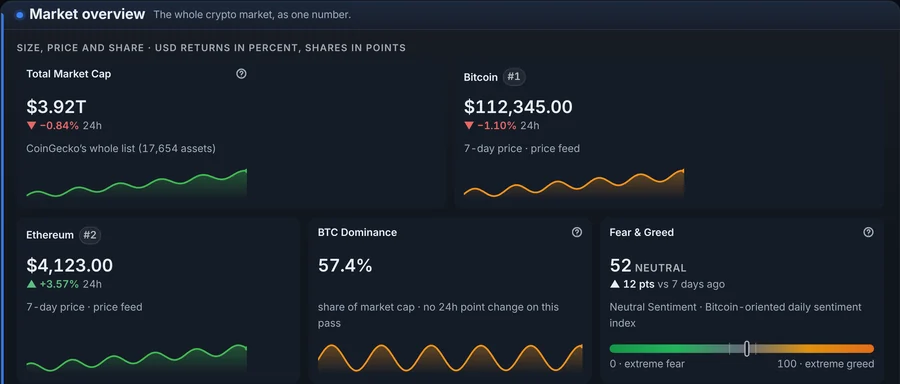
Doing this in CycleLens
Sources
- CoinMarketCap: Bitcoin dominance chart — a dominance figure with stablecoins in the total.
- CoinGecko: methodology — market value as price × circulating supply, and how the global total is built.
- CoinGecko: global charts — stablecoins shown as a share of the total crypto market value, so they are counted in it.
- TradingView: dominance by market cap — a dominance index measured against the top 125 coins rather than every listed coin.
- StockCharts ChartSchool: advance-decline line
- StockCharts ChartSchool: percent above moving average
- S&P Dow Jones Indices: S&P 500 Equal Weight Index FAQ — the same difference between weighting by size and counting equally, in equities.
About this article
- Written by
- Drafted by CycleLens with AI assistance
- Checked
- Fact-checked against the sources listed below.
- Approved by
- The founder of CycleLens, 9 October 2026.
- Disclosure
- The founder may hold or trade crypto assets, including ones this guide discusses, at any time. Nothing in this guide is a recommendation to buy, sell or hold anything.
- How this is kept up to date
- Re-checked every six months, and whenever a source it relies on or the CycleLens method it describes changes. The date at the top moves only when the guide changes in substance; a typo fix does not move it.
- Corrections
- Found an error? Write to support@cyclelens.ai. Corrections are made in the open, as the corrections policy describes.
Try CycleLens
The dashboard needs no account. Pro can be tried free for 7 days, with no card.