
Open interest versus trading volume: what each one actually tells you
Both figures sit side by side on every derivatives page, and they are easy to read as two versions of "how busy the market is". They are not. One counts activity over a period; the other counts positions outstanding at a moment.
The short answer
Trading volume counts how much changed hands over a period. Open interest counts how many futures contracts are still open at a moment. Every trade adds to volume, but a trade only raises open interest when both sides open new positions, lowers it when both sides close, and leaves it unchanged when one side opens and the other closes. Volume measures activity; open interest measures how much positioning is outstanding.
One market, four trades
Take a futures market with no open positions, in contracts worth one coin each. Every long position has a short on the other side, so the open longs always equal the open shorts.
| Trade | Buyer | Seller | Size | Volume so far | Open interest |
|---|---|---|---|---|---|
| Ann buys 10 from Ben | opens a long | opens a short | 10 | 10 | 10 |
| Cara buys 4 from Ann | opens a long | closes 4 of her long | 4 | 14 | 10 |
| Ben buys 6 from Ann | closes 6 of his short | closes her last 6 | 6 | 20 | 4 |
| Eve buys 5 from Dev | opens a long | opens a short | 5 | 25 | 9 |
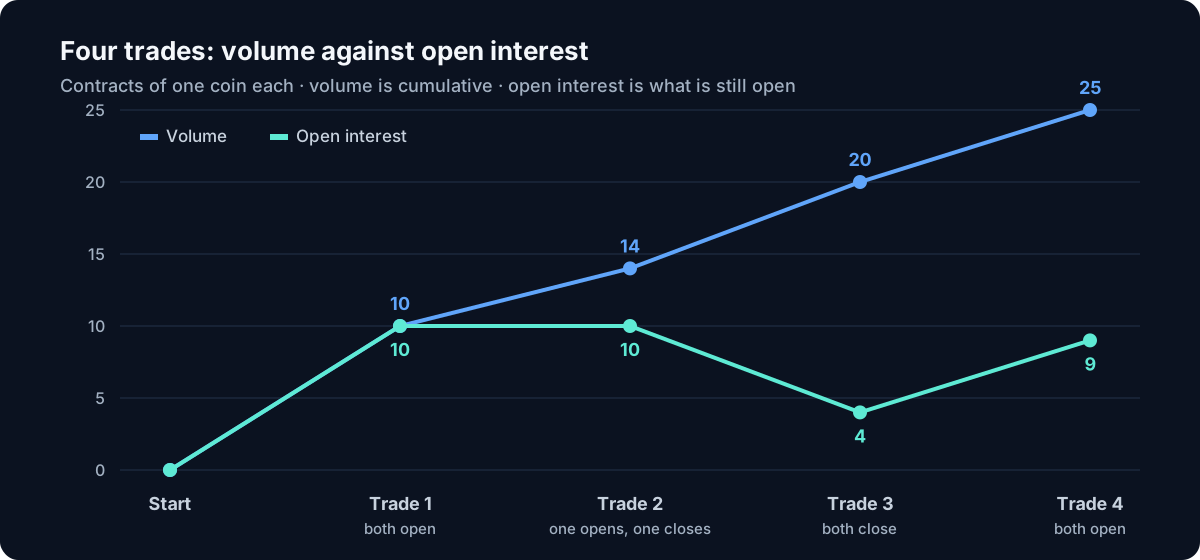
After four trades, 25 contracts have traded but only 9 are open. Trade 2 added volume without changing open interest, and trade 3 added volume while open interest fell.
The unit changes the story
Open interest is reported in contracts, in coins, or in dollars — and the dollar figure moves with the price. Suppose a market holds 50,000 BTC of open positions while Bitcoin trades at $100,000:
- At $100,000 that is $5.00 billion.
- If the price rises 5% to $105,000 and no position changes, it becomes $5.25 billion — up 5.0% with nobody opening anything.
- If the price rises 5% while 3% of positions close (to 48,500 BTC), it becomes $5.09 billion — still up 1.85% in dollars, although positions fell.
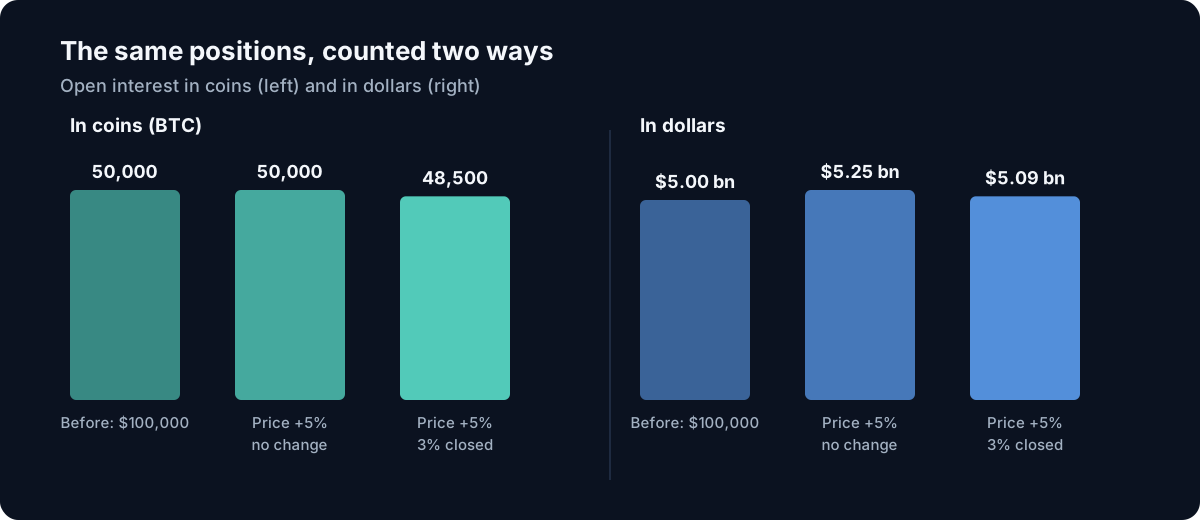
So read open interest in coins or contracts when the question is whether positions opened or closed, and check which unit a chart uses before comparing two sites — they also differ in which exchanges they add up.
Price and open interest together
Read with the price, a change in open interest says which side was pressing — as a tendency, not a rule:
| Price | Open interest | Consistent with |
|---|---|---|
| Up | Up | New positions opened as price rose — buyers opening longs were the pressing side. |
| Up | Down | Positions closed as price rose — shorts buying back to close. |
| Down | Up | New positions opened as price fell — sellers opening shorts were the pressing side. |
| Down | Down | Positions closed as price fell — longs selling to close, or being closed by force. |
Each row describes the side that was in a hurry; on the other side of every trade is someone doing the opposite. Funding rates and the share of seller- or buyer-initiated trades help tell the rows apart.
What volume can and cannot tell you
- Volume is mostly derivatives: on centralised exchanges, futures and perpetuals make up the large majority of crypto trading volume — about three quarters in March 2026 — so a spot-only figure leaves most of the activity out.
- High volume does not mean "people are buying" — every unit bought was sold. It means positions or coins changed hands quickly.
- A total built from several venues is only comparable with another built from the same venues, in the same unit.
Common misunderstandings
- "Open interest fell, so sentiment is bearish." It means positions closed — longs and shorts together.
- "Record open interest means a crash is coming." It means a lot of positioning is outstanding. That can unwind sharply, but it says nothing about when or which way.
- "Open interest is the same everywhere." Sites differ in unit, in which exchanges they include, and in whether they count one side or both.
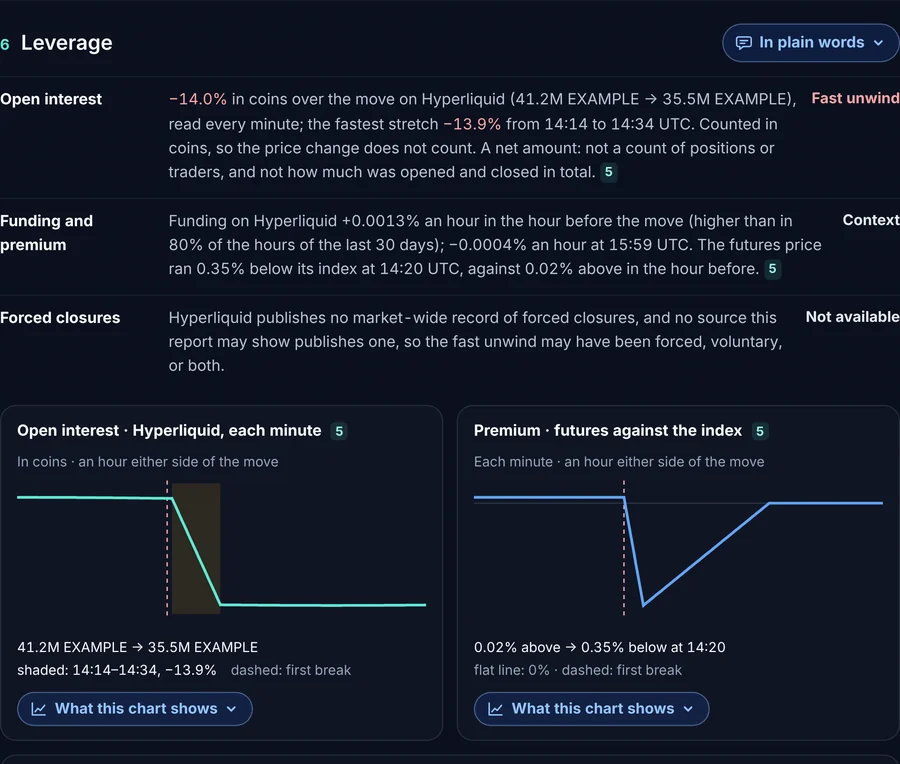
Doing this in CycleLens
Sources
- CME Group: open interest (Introduction to futures)
- CFTC: Commitments of Traders explanatory notes — open interest as the total of open contracts, with longs equal to shorts.
- Options Industry Council: open interest and why it matters — the opening and closing rule.
- Coin Metrics: reported open interest in US dollars — dollar open interest as contracts × contract size × the reference price of the underlying.
- Coin Metrics: market open interest — one-sided and two-sided counting.
- Glassnode: leverage, position openings and closures — the price-and-open-interest reading as an average tendency.
- CoinDesk Data: Exchange Review, March 2026 — derivatives' share of centralised-exchange volume.
About this article
- Written by
- Drafted by CycleLens with AI assistance
- Checked
- Fact-checked against the sources listed below.
- Approved by
- The founder of CycleLens, 9 October 2026.
- Disclosure
- The founder may hold or trade crypto assets, including ones this guide discusses, at any time. Nothing in this guide is a recommendation to buy, sell or hold anything.
- How this is kept up to date
- Re-checked every six months, and whenever a source it relies on or the CycleLens method it describes changes. The date at the top moves only when the guide changes in substance; a typo fix does not move it.
- Corrections
- Found an error? Write to support@cyclelens.ai. Corrections are made in the open, as the corrections policy describes.
Try CycleLens
The dashboard needs no account. Pro can be tried free for 7 days, with no card.