
How to investigate why a cryptocurrency price moved
When a coin falls or jumps, an explanation usually appears within the hour — often in a headline written after the move. This guide is a method for checking it against the market data: what to measure, in what order, and which conclusions the data can and cannot support.
The short answer
Work from the market data outwards. Pin down exactly which move you are explaining, check whether the whole market moved with it, find which markets moved first, read what positioning did and in what order, and only then place the news by when it was published. Keep what the data establishes — size, timing, order — apart from what it only suggests, such as who sold and why.
Step 1: define the move
"It fell 7% today" mixes two things: the change over the day, and the move that actually happened inside it. Write down the move you are explaining as a start time, an end time and a size measured over that interval. A coin can be down 7% over 24 hours because of one sharp 50-minute fall, or because of a slow drift — and the two need different explanations.
Use one clock (UTC) and one market for the measurement, and say which: prices differ slightly between exchanges, and between spot markets and perpetual futures.
Step 2: check the rest of the market
Over exactly the same interval, how did Bitcoin and Ether move? If the coin fell 9% while Bitcoin fell less than 1%, the move was the coin's own and a market-wide explanation (an interest-rate surprise, say) does not fit. If everything fell together, start from what moved the market, not the coin.
Step 3: find where it started
Look at the coin's main markets — spot and perpetual futures on several exchanges — on one-minute bars, and note the first minute each one made an unusual move: a break of a level it had held, or a bar far larger than the ones before it.
- If one market moved clearly first — two minutes or more ahead of the others — that is where the move appeared first. It is still not proof of who sold.
- If several moved within the same minute or two, the data cannot say where it began. Arbitrage keeps prices on different exchanges close together, and one-minute bars are too coarse to separate them.
- Perpetual futures moving before spot is consistent with leveraged trading leading; it does not establish it.
Step 4: read positioning, in order
Three figures from the futures markets describe what leveraged traders were doing:
- Open interest — how many futures contracts were open. A fall means positions were closed during the move. Read it in coins or contracts, not dollars: in dollars it falls with the price even if nobody closed anything. See open interest versus trading volume.
- Funding — the periodic payment between long and short positions on a perpetual future. Positive funding before a fall means longs were paying shorts to stay open — a sign of more demand to hold longs than shorts at that price. It is settled every eight hours by default, more often on some contracts.
- Forced closures (liquidations) — positions an exchange closed because their margin ran out. What matters most is when they began compared with the start of the move. Exchanges publish them only in part, and CycleLens does not show them, because no source it may show publishes them.
The order is the key evidence. Forced closures that begin before the price breaks are consistent with a liquidation-driven move. Forced closures that begin after the break are consistent with leverage adding to a move that something else started. Either way, timing shows the order, not the cause.
Step 5: read the trading flow
Exchanges report which side started each trade. A seller-initiated trade is one where a seller accepted the best bid; a large share of seller-initiated volume means sellers were the ones in a hurry. Every trade still has a buyer and a seller — "more sellers than buyers" is not what the figure means.
Step 6: check how deep the market was
Look at the order book — the buy and sell orders waiting to be traded — within 1% of the price, in the hour before the move broke. A book that thinned has fewer orders near the price, so the same selling reaches lower prices. It says how easily the price moved, not why anyone sold.
Step 7: place the news in time
For each story, note when it was published and compare that with when the move started. A story published after the move began cannot have started it, however well it describes it. A scheduled event — a token unlock, a network upgrade, an economic data release — was known in advance, so ask whether the price had already reacted before the day itself.
A worked example
The example below is drawn on an imaginary coin, EXAMPLE, with sample figures — the same coin CycleLens's own example report uses, so the screenshots match the text.
| Step | What was measured | What it shows |
|---|---|---|
| 1. The move | Down 9.5% from 14:10 to 15:00 on the Hyperliquid perpetual market; down 7.2% over the whole 24 hours. | The explanation is for a 50-minute fall, not for the day. |
| 2. The market | Over the same 14:10–15:00 interval, Bitcoin −0.8%, Ether −1.1%, Solana −1.9%. | The move was EXAMPLE's own. |
| 3. The start | First break at 14:12 on the Hyperliquid perpetual; the coin's two trading pools followed 4 and 5 minutes later. | The move showed first on the perpetual market. That is where it appeared first, not proof of who sold. |
| 4. Positioning | Open interest −14.0% in coins (41.2 million to 35.5 million EXAMPLE), fastest between 14:14 and 14:34; funding +0.0013% an hour before the move, −0.0004% after it. | Positions were closed quickly as the price fell; longs had been paying. |
| 5. Flow | Seller-initiated trades were 74% of the value traded; volume 2.8 times the hour before. | Sellers were in a hurry. |
| 6. Depth | The order book within 1% of the price was 39.8% thinner at the break (14:12) than an hour earlier. | The same selling could move the price further. |
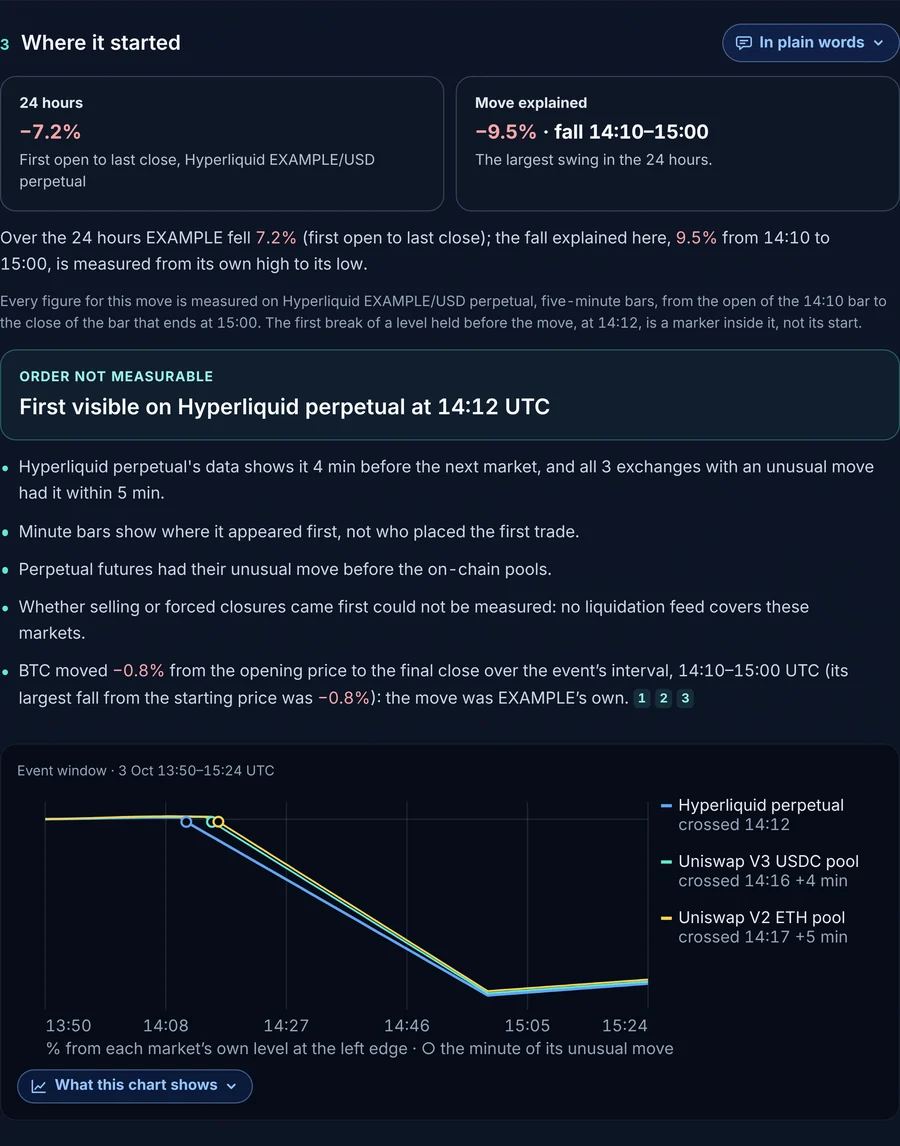
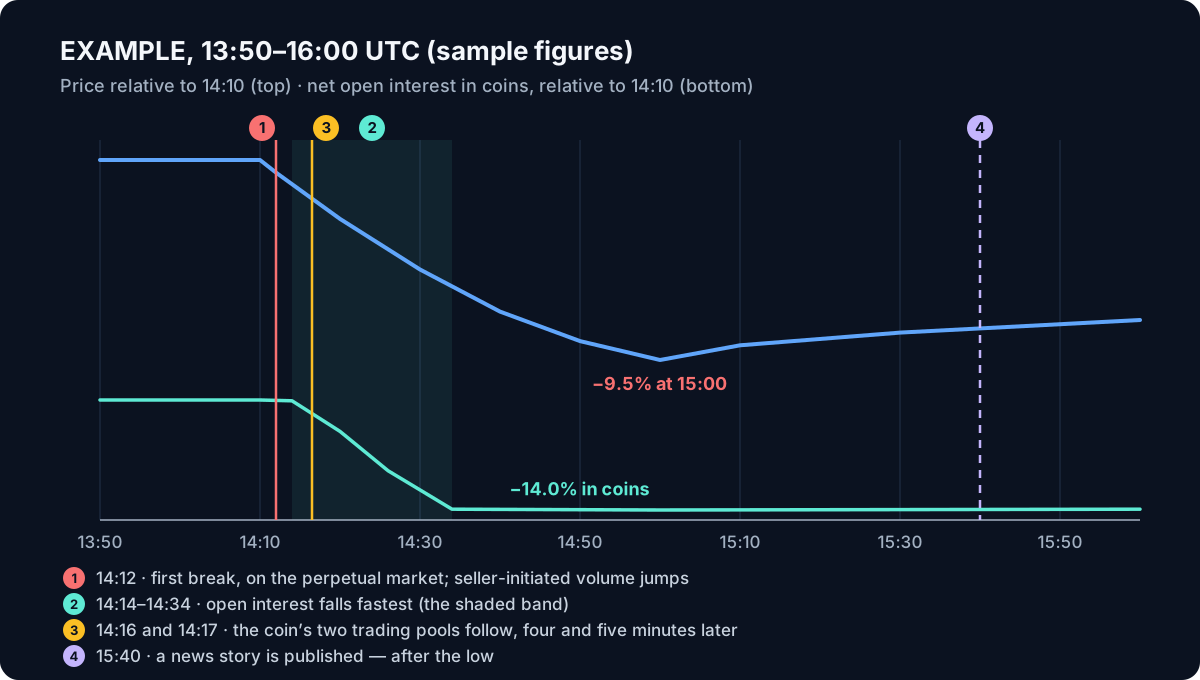
What the example establishes: the size and timing of the fall, that it was the coin's own, that it showed first on the perpetual market, that sellers pressed, that positions were closed and that the book had thinned. What it does not: who sold, and why. A careful conclusion reads: "a coin-specific fall, consistent with sellers pressing into a thinner book and leveraged positions being closed as it deepened."
Common misunderstandings
- "The exchange that moved first caused it." First to show a move is not the same as the source of the selling, and within a minute or two the order is not reliable.
- "Liquidations caused the crash." Only if they started before the break; forced closures that begin after it added to a move that something else started.
- "Open interest fell, so traders turned bearish." Every closed long is matched by a closed short or a new position on the other side; a fall means positions were closed, not that sentiment changed.
- "The headline explains it." Check the publication time against the start of the move.
Doing this in CycleLens
A Forensics report runs these steps on the last 24 hours of a coin — on its perpetual market on Hyperliquid, its own trading pools and its market price across exchanges — and states, part by part, what it established and what it did not. It does not show forced closures or the long/short ratio, because no source it may show publishes them. The Bitcoin and Ether reports are free to read without an account.
Sources
- Binance: kline and candlestick data (open time, UTC) — how one-minute bars are timestamped.
- Binance Academy: what is a taker? — a taker trades against an order already on the book; a seller-initiated trade is a sell by the taker.
- Binance: introduction to funding rates — who pays whom, and how often.
- Binance: liquidation order streams — only the latest liquidation order within each 1,000 ms is pushed, which is why totals are a floor.
- Coin Metrics: market liquidations — coverage gaps in published liquidation data.
- Australian Bureau of Statistics: correlation and causation
- GIJN: a guide to verifying digital content — checking when something was first published.
About this article
- Written by
- Drafted by CycleLens with AI assistance
- Checked
- Fact-checked against the sources listed below.
- Approved by
- The founder of CycleLens, 18 October 2026.
- Disclosure
- The founder may hold or trade crypto assets, including ones this guide discusses, at any time. Nothing in this guide is a recommendation to buy, sell or hold anything.
- How this is kept up to date
- Re-checked every six months, and whenever a source it relies on or the CycleLens method it describes changes. The date at the top moves only when the guide changes in substance; a typo fix does not move it.
- Corrections
- Found an error? Write to support@cyclelens.ai. Corrections are made in the open, as the corrections policy describes.
Try CycleLens
The dashboard needs no account. Pro can be tried free for 7 days, with no card.